Over the past five years I’ve worked with many large enterprises to help them deploy, manage and optimise their application performance toolsets (and their applications for that matter). I’ve encountered and used a large collection of APM products like OpTier, CA Wily, HP Diagnostics and dynaTrace - I’m always on the lookout for new application monitoring tools that enter the market. Two tools that caught my eye recently are AppDynamics and New Relic. Both companies are based out of San Francisco and have years of APM DNA in their leadership team and technology. What makes them particularly eye-catching is the way they are both attacking the cost/complexity deficiencies of the more legacy APM toolsets. New Relic and AppDynamics solve these deficiencies in slightly different and innovative ways and the purpose of this blog is to provide an overview of each solution and summarize my own thoughts on the approaches each has taken to simplify and disrupt the APM market.
Product Portfolio
A good place to start is with a simple overview of each vendors product portfolio. In 2011, it’s not uncommon for a product vendor to have a suite of APM products in their portfolio (usually via acquisitions). They do this so they can continue to meet the key criteria and expectations of industry analysts (think Magic Quadrant). Unfortunately, multiple products can often increase the complexity of APM along with the total cost of ownership for customers. The good news is that both New Relic and AppDynamics have kept things simple, and have made their products very accessible so its easy for people to evaluate and use their solutions without needing to contact the product vendor.
New Relic has four product offerings: Lite, Standard, Pro and Business, which are all available to trial or buy online via their SaaS subscription model. The Lite version is free. Other than pricing, the difference across their products is feature sets (e.g. Real User Monitoring, App Monitoring, Error analysis, alerting, reporting), data retention periods (30 mins, 7 days, unlimited) and of course the level of technical support.
AppDynamics in comparison has just two product offerings: Lite which is available as a free download, and Pro which is available as a SaaS subscription model or as on-premise software appliance to trial or buy via similar subscription based licensing. Lite has reduced features and is limited to a single server view whereas Pro is completely unrestricted from an agent and feature set perspective.
What is interesting, and perhaps unique is that both vendors have Freemium and SaaS offerings as part of their go to market strategy. This makes their solutions accessible to the masses for evaluation, which is completely different to traditional APM vendors who usually deliver evaluations through technical consultants. It’s quite novel to see such innovation, transparency and accessibility in a market where APM was often seen as an expensive luxury that only large enterprises could afford. With these two vendors, APM is now available for all to evaluate and test.
Rating: AppDynamics: Excellent, New Relic: Excellent
A good area to focus on next is how easily both solutions can be installed, deployed and configured. In the past this area has been one of APM’s biggest deficiency’s, largely influenced by the number of solution components required, and the team of APM consultants needed to implement, configure and support such a solution. It can take weeks to deploy some products, especially when there are a large number of touch points and technologies involved, each owned and supported by different teams.
As applications continue to leverage virtual, elastic and distributed computing platforms, many organizations simply cannot afford to keep re-configuring their APM solution every time their applications change with agile release cycles. The good news is that both New Relic and AppDynamics have simplified much of the cost and complexity associated with deploying APM.
New Relic’s architecture is exclusively based around their multi-tenant Software As A Service (SaaS) platform. User’s simply register online, download and install agents on their servers, and wait for data to be pushed to a central SaaS platform hosted by New Relic. User’s then log in and access their application performance data online. No management server hardware or install, no waiting around, just deploy your agents and you’re done.
AppDynamics deployment approach is similar to New Relic, but they’ve opted to give customers a choice of whether to deploy using SaaS or traditional on-premise software. User’s can register online, download and install both agents and mgmt server (if needed), before logging on and accessing their application performance data online. Customers therefore have a deployment choice as to leverage the cost/flexibility benefits of SaaS or to leverage the control/security/privacy benefits of traditional on-premise software which large enterprises often request.
What’s really nice is that the cost and complexity of deployment is minimal with both solutions so you can be up and running in less than half an hour. Both solutions use the -javaagent flag to load their instrumentation and the majority of configuration that you may need to do is performed through the GUI, not via editing xml/property files on the application server machines. This is very cool and saves tonnes of time.
Rating: AppDynamics: Excellent, New Relic: Excellent
Usability has historically been a big problem for APM solutions in the past, largely due to the amount of data being collected, and the limited number of concepts used to present such data (e.g. object trees, charts). Manual drill down through rows of performance data might suit some developers and power users, but may actually overwhelm an operations user who is simply trying to troubleshoot a problem in production. One thing I’ve noticed in many customers is that Operations are often the ones who troubleshoot application issues before development is called. An APM solution today must therefore be intuitive and versatile for both types of user. Dev and Ops have to work hand in hand, they therefore need a common tool and view to monitor application performance with.
New Relic’s user interface is purely browser-based, intuitive and easy to use. It has a nice range of metrics and views that are linked using simple navigation bars and hyperlinks. They’ve kept their UI and concepts very simple so the user experience is intuitive for any type of user. For example, within five minutes of clicking around you’ve accessed pretty much all the data, features and views that New Relic has to offer.
AppDynamics UI is also browser-based, intuitive and easy to use. It has a wide variety of metrics and features which are accessible via its use case driven navigation bar. Its UI has more functionality and richness than New Relic which makes it slightly more complex to navigate, but then again there is more data and features to exploit for the user. It’s flex based so it feels more like a desktop application than a web app.
Both products relative to previous generation APM products should be extremely intuitive and easy to use for dev and ops teams. I’ve used many monitoring products in the past and sometimes thought “what exactly am I looking at here”. I didn’t experience that once with either New Relic or AppDynamics.
Rating: AppDynamics: Excellent, New Relic: Excellent
Behaviour Learning & Analytics
An important and often under looked capability for an APM solution is to become familiar with the applications it monitors, so it can alert and guide users to business impact and slow downs in the application. Being pro-active is something you don’t often hear about with APM toolsets, largely because little intelligence exists in monitoring software to dictate what normal and abnormal performance is. Monitoring solutions, either end up generating no alerts or too many alerts, neither of which helps customers manage their IT. This area of APM is the first where New Relic and AppDynamics differ significantly, in how they approach the concepts of alerting and thresholds.
New Relic uses minimal behavioural learning but has basic analytics to surface key events to the user like application deployments, Apdex score changes, high error rates and high server cpu utilization. Thresholds for metrics like Apdex and server cpu are user-defined across an application and its servers. Transaction traces also have a user-defined threshold, with 2 seconds being the default. These simple thresholds might be ok to manage across applications but might also limit the type of performance slowdowns New Relic is able to detect. For example, not all transactions are the same, specific transactions may process more data than others, thus causing them to have differing response times. 1 second might be normal for one transaction and 3 seconds maybe normal for another, setting a static threshold for all transactions in an application therefore isn’t always possible.
Behavioural learning and analytics appears to be very central to how AppDynamics works. Its ability to track, determine, and baseline the normal performance of every business transaction in the application with no configuration is impressive. This allows the tool to automatically detect performance slowdowns without user specified thresholds across one or more applications. This automation however, does require base-lines to be observed over several days so accurate thresholds are created. The baselines are also dynamic in the sense they adjust over-time, based on seasonal patterns or historical trends which AppDynamics observes. For example, if an application normally experiences higher transaction volume and/or response time on Fridays or at the end of the year, users won’t be alerted unless performance deviates from the related daily or monthly baselines.
New Relic has yet to venture into behavioral learning capabilities but does offer basic analytics, whereas AppDynamics has strong capabilities in both areas. In an age where agile methodology drives frequent change for applications, its important that monitoring solutions can adapt so that they monitor the right data at the right time to help development and operations teams manage and troubleshoot application performance more efficiently. Their is nothing worse than being asked to investigate an issue and finding out little data exists for the time period you’re zooming in on.
Rating: AppDynamics: Excellent, New Relic: Weak
The most basic function of an APM solution is how well it can visualize and report application performance back to the user. Back in 2004 legacy APM vendors did well monitoring monolithic applications, which had relatively simple three tier architectures (web, app, database). Today, applications are very different, technology shifts in SOA and cloud computing, have made architectures more distributed, virtual and elastic. It’s therefore interesting to see how New Relic and AppDynamics approached these challenges in each of their solutions.
New Relic considers an application to be a collection of servers from which its agents are deployed on. It therefore aggregates data across these agents to provide a variety of high-level application and infrastructure metrics, which are reported over-time using multiple charts within the UI. Apdex for example, is used frequently in the product to represent overall application performance so its possible to spot application wide issues. New Relic also provide an “App Map” view which provides the user with a summarized logical visualization of application flow and services, along with their associated invocation count and response time.
New Relic - App Map
AppDynamics also represents an application as a collection of servers. However, their monitoring capabilities seem to go one level deeper, and show the physical distributed complexity of an application and its performance, as opposed to providing a logical abstraction like New Relic. AppDynamics application flow also has the ability to overlay performance baselines to help users visualize where performance issues are occurring in the application architecture.

AppDynamics - Application Flow Both vendors have attempted to monitor and represent the complexity of a distributed application. In simplifying this view, New Relic has opted to abstract and summarize the complexity of a distributed application and its service performance. Whereas with AppDynamics you get a sense that your looking at the complete end to end flow of an application, giving you a much wider view of its performance.
Rating: AppDynamics: Excellent, New Relic: Good
Business Transaction Monitoring
As applications become more distributed and complex, so does business logic and user requests. In fact we’ve seen many Business Transaction Management (BTM) vendors try to succeed in APM over the past two years, by simply tracking how business transactions flow across IT infrastructure. As a result, “transaction profiling” was added to both Gartner’s and Forrester’s definition of what APM should contain. As you’ll read New Relic and AppDynamics differ in how they address this area of APM.
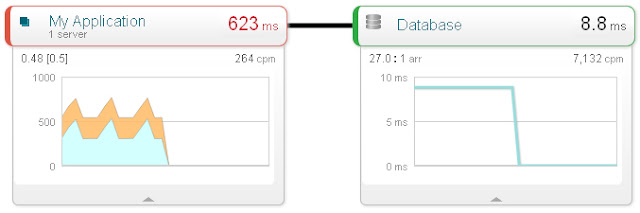
New Relic use the terminology “Web Transactions” to denote the various application requests (e.g. URL/Struts/JSP/JSF) that are processed by the servers, which they monitor. They also have a concept of “Transaction Traces” to represent instances of “Web Transactions” that are slow or breach a given threshold. The concept of a “Business Transaction” or applying Business Context to application monitoring seems to have been ignored by New Relic, as is the capability to track a visualize a transactions journey across a distributed application.
![]()
New Relic - Web Transactions
AppDynamics does use the terminology “Business Transactions” to denote the applications requests it monitors, and also tries to discover the business name behind each request, so users can manage performance with business context (you can also label the transactions to give them friendly names). AppDynamics has a concept called “Snapshots” which is similar to New Relic “Transaction Traces”. However, unlike Transaction Traces, Snapshots show the entire end-to-end journey of a business transaction across a distributed application. The ability to therefore monitor and troubleshoot business transactions is more powerful.
![]()
AppDynamics - Business Transactions To summarise, New Relic monitors web transactions but doesn’t attempt to represent them with any business context, or report their distributed end-to-end flow. AppDynamics in comparison has strong distributed business transaction tracing, and is clearly an area they excel in. The more complex and distributed an application the more AppDynamics becomes powerful for monitoring and troubleshooting application performance.
Rating: AppDynamics: Excellent, New Relic: Weak
Diagnostics is a critical and core feature of any modern day APM solution. It essentially helps a user identify the root cause of an application performance issue, by providing visibility into the performance of application code and the run-time environment. This deep visibility helps operations and development teams reduce their Mean Time To Resolution (MTTR), which has become a well-adopted metric for benchmarking success and ROI of APM toolsets.
New Relics “Transaction Trace” feature captures code execution of web transactions within a single server, that breaches a user specified threshold (default 2 seconds). These traces provide visibility into the latency of code and common interfaces that are invoked by a web transaction, thus allowing users to resolve bottlenecks such as slow SQL and CPU intensive invocations. New Relic also has a manually triggered feature called “Thread Profiler”, which as the name suggests, profiles the execution of running threads inside a JVM and aggregates stack traces over-time. It allows a user to spot where clock time and CPU is spent during a slowdown. You can run the thread profiler for a period of time but its something you wouldn’t want to run all the time as it can introduce overhead to the application. It’s designed to be used to collect diagnostic data when experiencing an issue. New Relic also provides visibility into the application run-time and server OS with KPIs into resource metrics like CPU and memory consumption.
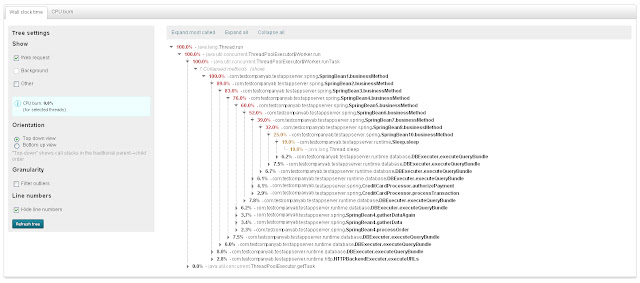
New Relic - Thread Profiler AppDynamics automatically triggers deep diagnostics (known as “snapshots”) of business transactions, that deviate from their normal performance baseline or throw an error. Snapshots are unique in that they provide complete visibility of code execution latency (both common and custom interfaces) whilst managing to incur minimal overhead to the application being monitored. This approach is different to most APM vendors who balance code level visibility with overhead in production (continuous profiling vs an automated diagnostics on demand approach). This makes root cause analysis very fast with AppDynamics providing the right amount of information to troubleshoot the problem at hand. AppDynamics also provides deep visibility of the application run-time via JMX and OS metrics, it also has Java memory forensics as well to help users understand and resolve memory leaks.
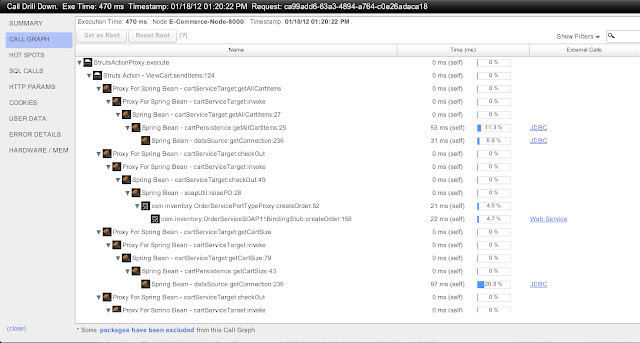
AppDynamics - Snapshot Again, New Relic has opted for a more simplistic approach when it comes capturing application diagnostics based on static thresholds. This is different to AppDynamics in that diagnostic data collection is complete, automated, and only triggered when the performance of a business transaction deviates from its normal baseline. AppDynamics also provides out of the box diagnostics for JMX, memory forensics, deadlocks and stall detection, something which New Relic has not chosen to offer yet.
Rating: AppDynamics: Excellent, New Relic: Good
Real User Monitoring
Real User Monitoring or RUM is the ability to measure the response times the actual users are experiencing at the browser level. It provides various metrics such as page load times, javascript execution times, browser types, html object sizes etc. There are different approaches to RUM and AppDynamics and New Relic both use different techniques to measure end user experience.
New Relic uses a javascript injection technique on the application server level. It’s agent is able to dynamically inject javascript into web pages as they are built. This javascript is then executed on the user’s browser and timing data and other useful metrics are collected. The data is then sent back to the New Relic cloud asynchronously so as not to impact performance.
AppDynamics does not have a RUM capability as part of it’s own product yet however its Pro version does come with a RUM option which allows AppDynamics to be linked with other RUM products on the market (currently BMCs/Coradiants End User Experience Management product is supported). BMC EUEM is a passive monitoring solution. I will cover this approach to APM in detail in a later blog post but essentially a device or software appliance is connected into a network tap or SPAN on a front end switch within the data centre. The device monitors application network traffic as it flows back and forth from the user to the web / app servers. This traffic is analysed and a performance profile of the web transactions is created. Algorithms which analyse the TCP layer are used to calculate how long web transactions are spending in the data centre and how long they are spending outside the data centre and in the browser. This data can then be linked to AppDynamics performance data to get a full end to end performance profile from the browser through to the application and back end systems.
New Relic’s approach here is very simple and quick to deploy (literally a tick box) and provides good capabilities. AppDynamics requires integration with a third party product which makes things a little more complex. Once the integration is deployed however the ability to track a users business transaction from the browser through multiple application components into back end systems and back out to the user is very powerful.
Rating: AppDynamics: Good, New Relic: Excellent Language Support
Language support coverage dictates what languages and applications an APM solution can monitor. The majority of APM vendors today provide support for Java based applications, with many also providing support for Microsoft .NET as well. Again, New Relic and AppDynamics have different strategies in this area which has both benefits and limitations.
Today, New Relic probably has the broadest support for platform languages, supporting a total of 5: Java, .NET, PHP, Ruby and Python. Their strategy is definitely to provide an APM solution which is more broad than deep, thus enabling them to monitor more types of applications than most APM vendors. Their only limitation is that their feature set isn’t entirely consistent across all of the platform languages they support.
AppDynamics in comparison appears to have a deeper focus on Java and Microsoft .NET based applications, but has yet to provide support for PHP, Ruby or Python. Their strategy at present seems to be set on providing powerful/deep visibility into the languages and applications they support, rather than trying to broaden and support basic features across all types of applications.
Rating: AppDynamics: Weak, New Relic: Excellent
Conclusion
As I mentioned in my previous post the choice of APM product should always go beyond just feature sets and look at other factors around how you operate as a business. That said here are my thoughts on these two great products…
Both AppDynamics and New Relic have moved the game along for APM. They both address the fundamental weaknesses of legacy APM solutions by being inexpensive, simple to deploy and easy to use with a low cost of ownership. However, the value each provides varies depending on the complexity of the application they are monitoring.
New Relic is a good fit for small to medium size businesses that have relatively simple application architectures which rely on a variety of technologies. It’s also a great fit for web applications built using scripting languages like PHP, Python (Django!) and Ruby.
AppDynamics is a good fit for organisations that have more complex, distributed application architectures which rely solely on Java and .NET technologies. Since it offers both SaaS and on-premise options, it’s also much more suited to companies who don’t want to or can’t store their data in “the cloud” and need to use an on premise solution.
Give them both a try and see for yourself!